
In brief
-
01
Project
POSiFLORA Sales Accounting System
-
02
Tasks
- Monitor system performance, uncover errors
- Notify specialists on Telegram regarding errors
- Ensure system stability during peak usage
-
03
Tools
- Zabbix monitoring system
- Monitoring based on Prometheus and Grafana
-
04
Results
- Monitoring system successfully implemented: operation of the system is now constantly monitored
- When errors are found, the system immediately reports via Telegram
- POSiFLORA has 99.95% uptime, with possible emergency shutdown time of less than one hour a year
Project: POSiFLORA CRM system for flower business
POSiFLORA CRM system helps the flower business keep work under control: selling bouquets, considering the balance and hours of work of employees, and planning purchases. All processes are accessed from one interface. It’s exceedingly convenient to work with POSiFLORA.
More than 8,500 users already work with the system, from small studios to large flower chains with multiple locations.
Tasks: to monitor operation of the system and prevent breakdowns
POSiFLORA consists of two parts: the client and the server. The client part is the outer shell, the interface used by executives and florists. With the help of the client part, clients give orders to the system regarding the formation of bouquets, sales, and accounting for balances. The server part is the «brains» of the system, everything that’s hidden under the hood, such as accounting rules, databases, etc. Florists and managers don’t see the back end, but if it breaks, the system won’t work.
To control the operation of both the server and client parts, OrbitSoft has created a monitoring system. Simply put, its task is to monitor the smooth operation of both parts of the system, as well as prevent breakdowns. To do this, we use the monitoring systems known as Zabbix and Prometheus. Let’s talk about this in more detail…
What tasks does the Zabbix monitoring system solve?
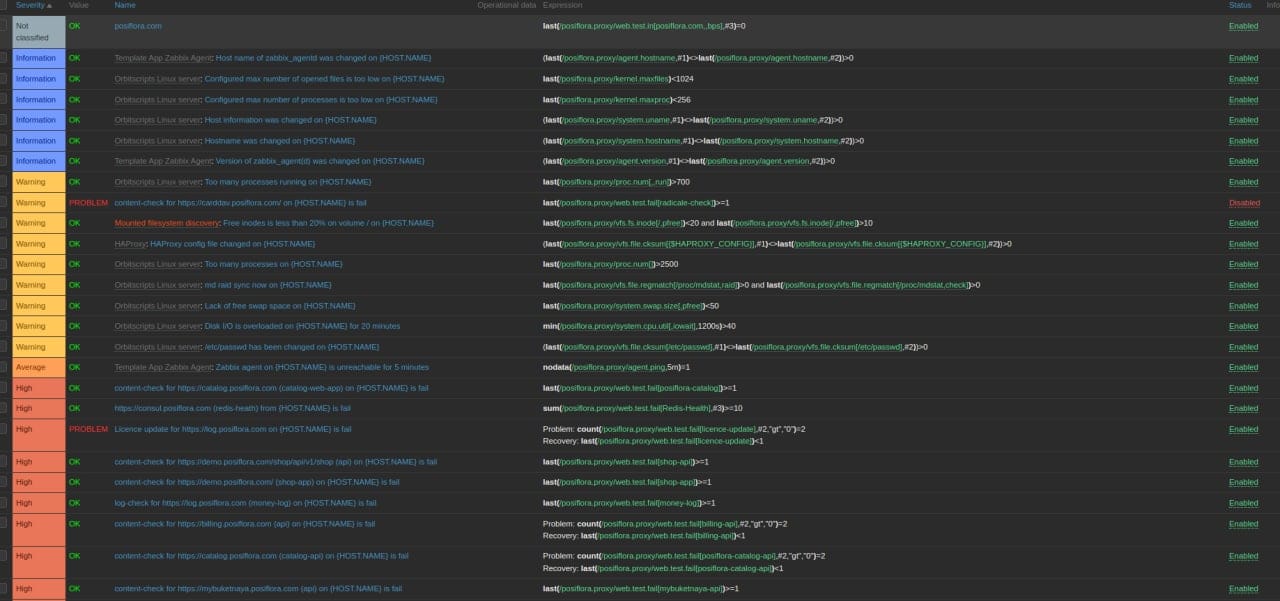
The Zabbix monitoring system is a universal tool for monitoring the work of both the server and client parts of the system. It collects statistics on the operation of all parts of the system, analyzes this data, finds errors, and sends notifications regarding any errors found.
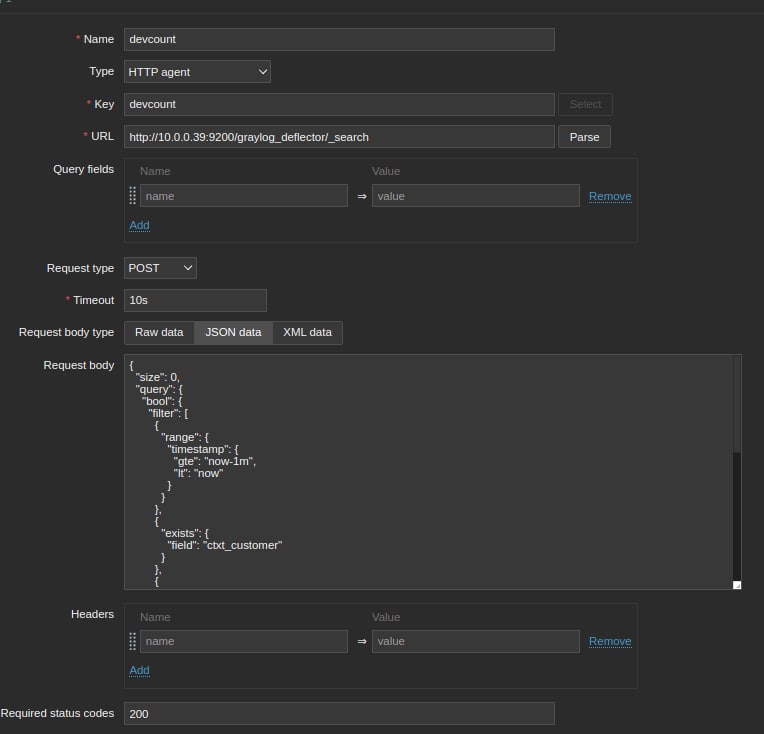
The principle of operation is as follows: We create a request to check the system indicator we need, and then Zabbix collects data and builds visual graphs. Here are the tasks it solves:
Checking the performance of system indicators. We check the number of active devices, download devices, download speed, server memory usage, CPU load, traffic, and more. The system monitors health through queries, and then stores this data.
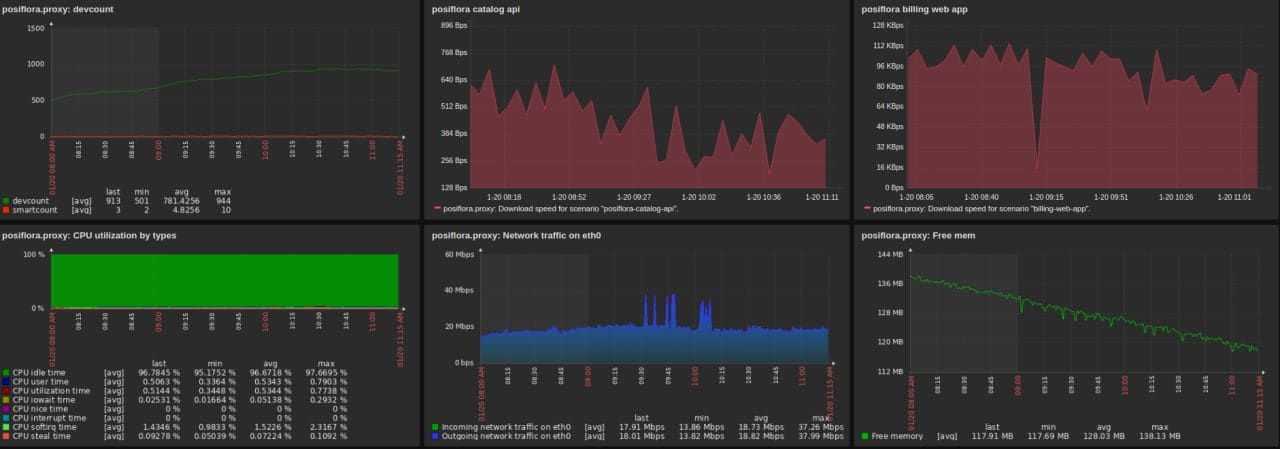
Visualization of system operation. To make it more convenient for specialists to monitor performance, the system visualizes data in the form of graphs on the dashboard. This helps to reduce the time spent on analysis. A specialist immediately sees that there is a problem, and can begin solving it right away.
Finding errors and dangerous situations. For the system to be able to find errors and track situations that are dangerous for system operation, let’s say, for example, an imminent server overload, the DevOps engineer creates «triggers». That is, he or she sets the value of the indicators, and describes the conditions by which Zabbix understands that something has gone wrong.
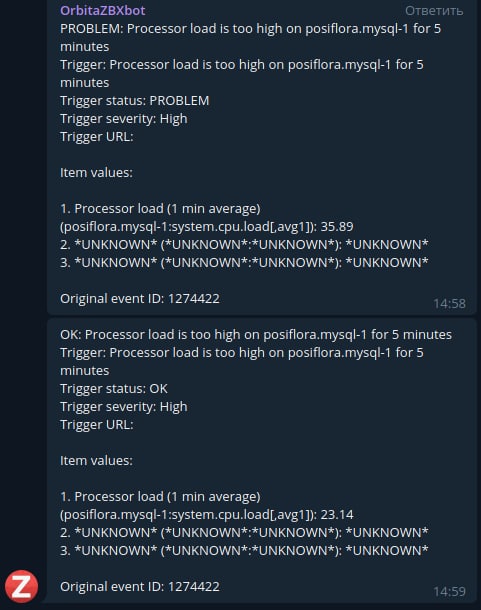
Hazard Warning. If Zabbix finds a dangerous situation, it immediately sends a notification about it through Telegram. The DevOps engineer sees this, and fixes the issue before it manifests as a real problem.
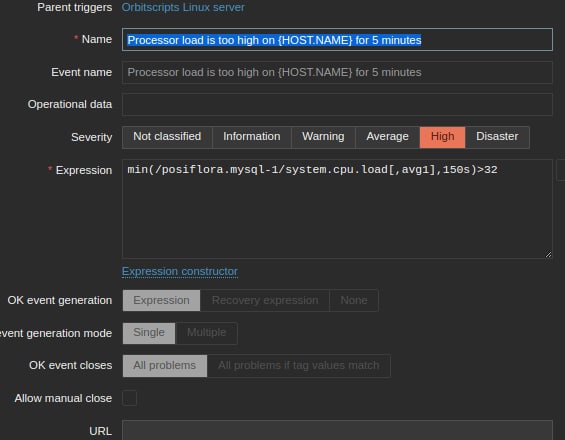
Trigger conditions description example. It fires if the average 32-core CPU usage exceeds 100% over 5 minutes.
What tasks does the Prometheus monitoring system solve?
During the holidays, the number of sales increases, and the load on the server and client parts of the POSiFLORA system also increase. The Zabbix monitoring system can barely cope with the load. Because of this, the risk that the servers will become overloaded and the system will stop working increases.
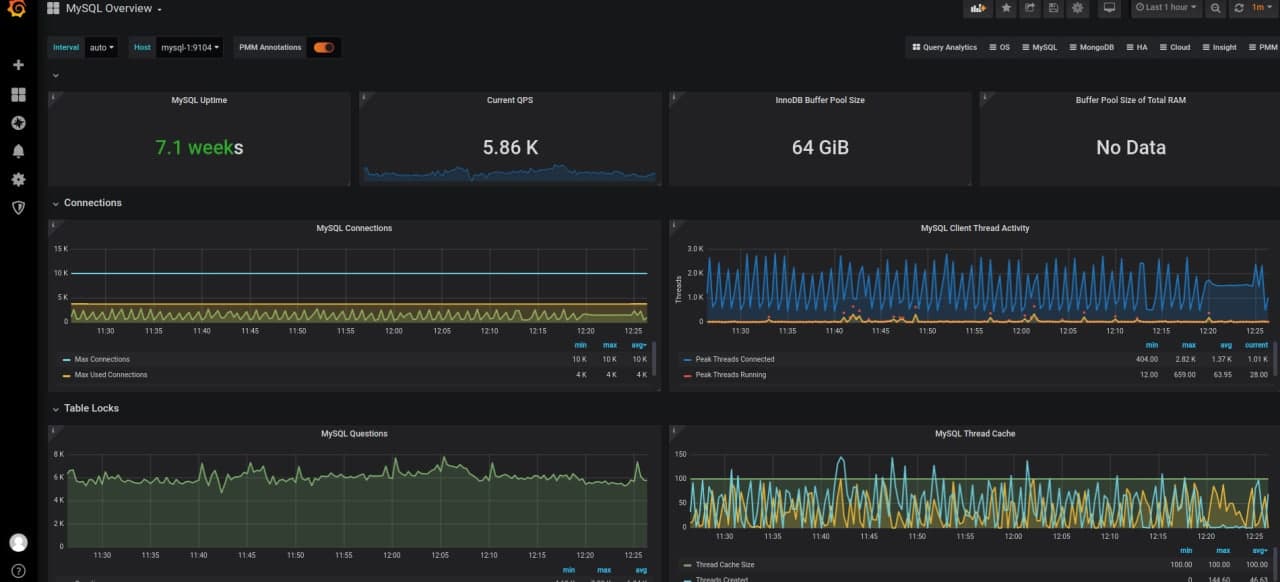
To offload the monitoring system, we rebuilt it on Prometheus. Prometheus itself is just a database that stores time-based information. To get a full-fledged monitoring system, it’s supplemented by exporters. Exporters are Prometheus agents that are on the target server. They collect the necessary metrics, translate them into a language understandable to the database, and send them by request. In our case, Node Exporter and MySQL Exporter send data approximately every 10 seconds:
- Node Exporter collects system metrics: data on RAM usage, CPU load, and hundreds of other indicators
- MySQL Exporter collects MySQL database server metrics
Exporter metrics are collected in the Prometheus database. To make it convenient to work with, Grafana, a visualization tool, is connected to it. It builds informative graphs, and sends error notifications by Telegram.
Detection of problems in the operation of the Zabbix monitoring system. When Prometheus took over server monitoring, the number of network connection dropped significantly, and the risk of congestion was eliminated.
We found that the problem of extra connections of the Zabbix agent was related to its reaction to restarting Docker containers. Containers are safe «packaging» for program code. Using them, the code is loaded onto the server and executed without conflicting with other system components. POSiFLORA is built using separate microservices, each of which runs in a separate container.
In our case, the containers are not just restarted, but re-created. Each time Zabbix recognized one as a new monitoring object, it added it to the check list, which created a lot of unnecessary network connections. Because of this, the overload increased.
Load distribution between monitoring systems. First, we reduced the container data storage period to one day, and figured out how to restart them, so the load on Zabbix decreased significantly.
However, we liked how the Prometheus-based system performed in server monitoring. For example, regarding containers, Prometheus did better because, unlike Zabbix, it receives and sends all metrics in one connection. Zabbix is good at monitoring various web services such as POSiFLORA.
We decided to split the monitoring between them:
- The state of the server, including containers, is monitored by Prometheus in conjunction with Grafana, and the Node Exporter and MySQL Exporter.
- The work of POSiFLORA components continues to be monitored by Zabbix.
Results: Distributed the load and ensured smooth operation of the system.