
In brief
-
01
Kind of tool
Predictor — AI module for predicting click-through rate
-
02
Where we use it
Advertising platform
-
03
What tasks it solves
- Analyzes behavior of potential buyers
- Predicts number of clicks on banners from different sites
- Provides the advertiser with suitable ad platforms
- Saves on costs, as well as increasing the effectiveness of an advertising campaign
-
04
Kind of businesses it’s suitable for
- Advertising networks and platforms for purchase of ad traffic
- Advertisers
- Advertising platforms
- Recommendation services
This platform helps companies find ad platforms
Our customer is a popular advertising platform. It helps companies find platforms on which to advertise.
For example, one partner on the platform is a bank. It has customers who use the app every day. With it, companies can offer the bank’s clients services and goods with a discount.
The platform not only connects the advertiser and the site with each other, it also offers various services to them: holding auctions, consulting, and algorithms to improve the effectiveness of advertising campaigns.
Problem: companies lose money on unsuccessful advertising campaigns
Companies have a problem: they often don’t know which ad space to choose. They make a choice based on a brand being well-known, or at random. As a result, an ad can have almost no views or clicks, the company loses money, and the platform loses customers.
The platform decided to introduce a new service: predicting the click-through rate of ads. To do this, we needed a module that could analyze user behavior, and predict the likelihood of a click.
Solution: check campaign performance with a mathematical algorithm
To develop a solution, the advertising platform contacted OrbitSoft. This is how we began work on creating the Predictor module. The Predictor module is a code that’s embedded in the architecture of the platform, and the user sees additional functions in his or her personal account when creating an advertising campaign.
Predictor analyzes data regarding user behavior, and finds patterns in it. The predictor then creates a prediction of where the ad would be best placed to be clicked on.
This helps companies better place ads to reach their target audience.
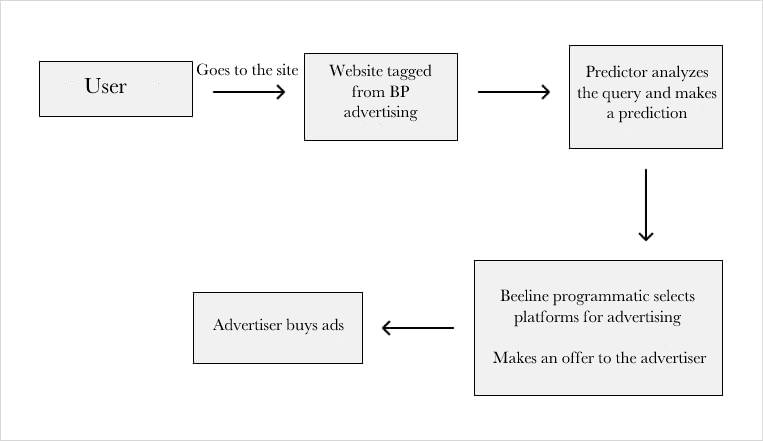
It works this way: the user enters a request, and the Predictor then collects data from storage. Further, a mathematical model analyzes the data. After analysis, the module predicts which advertising the user will react to. Based on this data, the platform selects sites with the highest click-through rate.
There are four steps in creating a forecast:
- Collection of data for analysis
- Formulation of forecast hypothesis
- Creation of the forecast
- Testing the forecast on real requests
Stage 1. Collecting data for analysis
To create a forecast, you need input data: the kind of advertising we are analyzing, user actions, and the technical configuration of the request. The information is provided by the advertising platform from the open protocols of the browser and its storage. When registering on the platform, users allow us access to their data.
Data table for creating a forecast
| Advertising information | — Banner, Pop-up, Ad — Ad topics — Advertiser — Site address |
| User actions | — Clicked — Ignored — Closed — Unsubscribed — Complained — Stopped — Watched the video to the end |
| Tech data | — User agent — IP address or partial IP address — User device — Browser — Screen aspect ratio — Geo-location data |
We divide the data into two equal parts. We use one part of the data to create a forecast, and the second to test it.
Stage 2. Formulation of a hypothesis. Next, we filter the data by categories according to the advertiser’s request. For example, an online sporting goods store accesses the platform, and the customer wants to understand where to place advertisements for the sale of fitness bands. We retrieve platform data, and set filters by ad subject, ad space, device type, and number of ad clicks.
As a result, we generate something like the following example information:
- Advertising for fitness bands is most often placed places where people play sports
- Users most often click on pop-ups
- The most clicks on ads are from inexpensive iPhone and Android models
Next, we formulate a hypothesis for the forecast: an online sporting goods store needs to place fitness bands in the form of pop-ups at sports and fitness locations. Most likely, the target audience is young people from 20 to 35, with low and middle incomes, who prefer to buy online, using mobile applications.
Stage 3. Creation of a forecast. The model creates a mathematical algorithm to generate numbers that help to predict and refine the hypothesis. To do this, the module builds a function of dependence of some data on other data, and finds common overlaps.
For example, we assume that students are more likely to click on ads for low-cost fitness bracelets. We enter the data of our hypothesis: age — up to 35 years, mobile devices, type of advertising — banners, advertising placement — sports and fitness locations. The model processes the request and produces the numbers: in three months, 1000 visitors under 35 years old, clicked on the banner of the fitness bands of the company’s main competitor, at certain sports and fitness locations, 700 times.
Thanks to the algorithm, we get real numbers for the forecast: if an online store places an advertisement for fitness bands at sports and fitness locations, and sets a price similar to the price of the competitor, 20% of visitors will click on the ad.
Stage 4. Testing the forecast on real queries
Next, we test the model. We compare the hypothesis forecast with the real result from the second part of the data that we prepared at the beginning.
For example, the forecast promises that 20% of sports and fitness users will click on a banner advertising fitness bands. We look at the data for the previous three months from competitors, and check if these clicks occurred.
If the forecast and data from the past coincide, then the hypothesis is correct, and the forecast can be considered accurate.
If the model predicts clicks, and there were no clicks, the hypothesis is not confirmed. Then we go back to the beginning and test a new hypothesis.
Testing accuracy is measured as a percentage. For example, we tested the hypothesis that 70 out of 100 visitors will click on the banner. The prediction accuracy is 70%.
Result: the effectiveness of advertising campaigns increased by an average of 20%
To test how the click-through rate improves with the Predictor module, we researched real-life ad campaigns. The study involved banks, e-commerce, booking services and aggregators, and media. The data was provided to us by an advertising platform.
We were interested in CTR, the ratio of clicks to impressions. For example, in an advertising campaign for a flight aggregator, without using the Predictor module, the CTR was 5.8%. When the forecast was added, the CTR increased to 9.06%. The flight aggregator received more ad clicks thanks to the forecast.
The study found that 10 advertisers had an average CTR increase of 20%. The cost of an ad campaign hadn’t changed, but the accuracy had increased.
Technical block
Data storage
- Servers ABC, C3 — cloud solution from Amazon
- AWS S3 protocol supported by MinioHadoop
- 1.2.1 for calculating statistics and remarketing lists
Data Libraries
- TFS (Tensorflow Serving) www.tensorflow.org/tfx/guide/serving. Clicks on banner for fitness band of a company’s main competitor at particular sports and fitness locations.
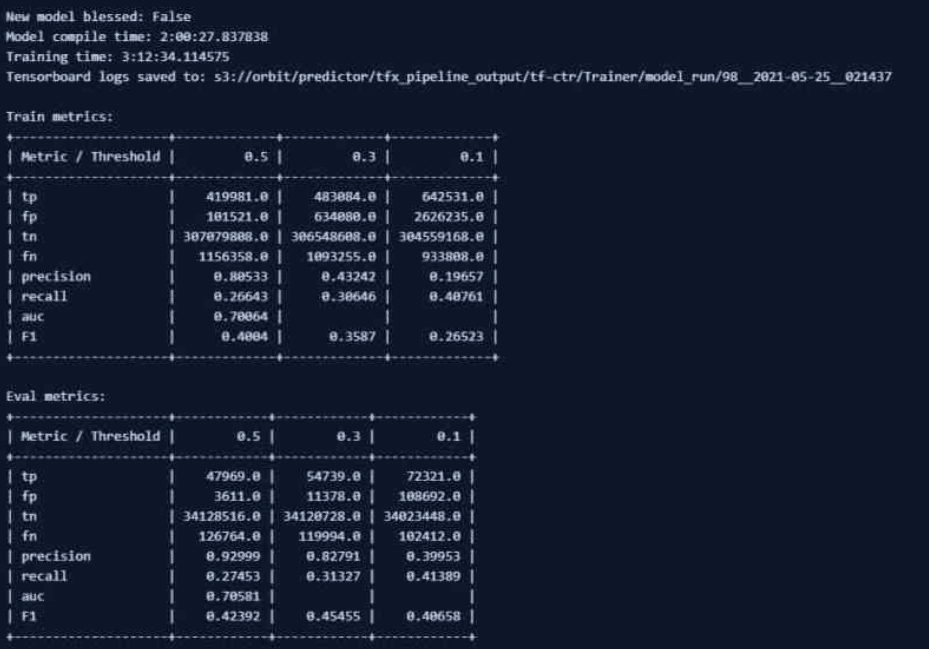
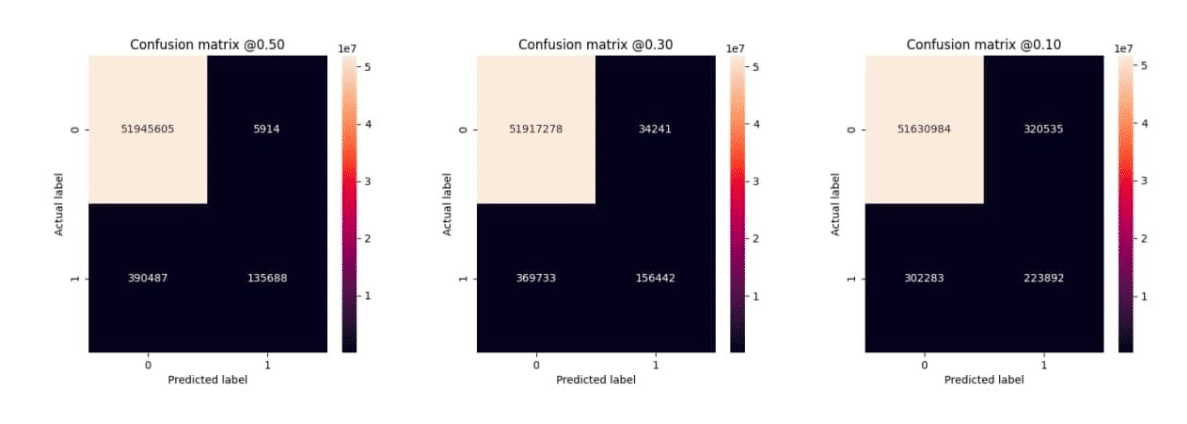
- TFMA (TensorFlow Model Analysis) www.tensorflow.org/tfx/guide/tfma. Calculates model metrics. If analytics confirm that model results have improved, the current version is updated. If forecasts for the new (candidate) model are worse than for the current (baseline), then the model remains unchanged.