
In brief
-
01
Customer
Video aggregator, generates income from ad impressions
-
02
Problem
Each video has several preview images. Some of them are blurry. Users do not open such videos, and do not watch ads in them, and the company loses income
-
03
Task
Apply data science methods: develop a Python module that sorts images by quality to find and remove all poor-quality images
-
04
Result
- Conducted research and proposed a principle of image quality assessment. Together with the customer, we determined the criteria, i.e., which previews are considered high-quality, and which are not
- Developed a Python module that sorts images by degree of blur
- Module analyzed 50 million images: found 4.7 million in very good quality. The rest are of normal quality
- Spent a week from technical specification to result
- The customer was able to remove all low-quality previews from the site and increase the number of views
Customer: video aggregator
The company owns a video platform that collects entertaining videos from many other sites. When a visitor selects a video to watch, the aggregator redirects them to the content owners' website. The platform is rewarded when users watch ads on source sites.

There are over 13 million videos hosted on the platform. From content owners, the company receives images for previews. Each video has from 1 to 10 of them, more than 50 million images in total.
Issue: Some of the video preview images are of poor quality
Some of the previews were of poor quality, and the platform didn’t perform any verification before downloading. Users didn’t click on videos with blurry previews, and therefore didn’t watch ads, and the company was losing revenue.
The customer decided to remove all low-quality images, but doing so manually in such quantity is labor-intensive. If you looked at each image for even just one second, it would take about 14 thousand hours. The customer turned to OrbitSoft to automate the process.
Solution: developed a Python module that assessed image quality
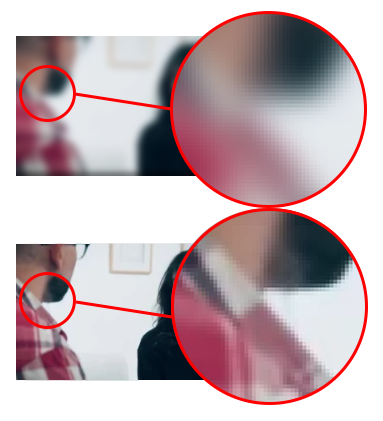
High-quality images are clear, low-quality images are blurry. Our task was to teach the algorithm to mathematically determine the degree of image blur. We started by studying specialized literature regarding this issue.
For example, in the article Analysis of focus measure operators in shape almost 36 methods for calculating the blur index are considered. We noted for ourselves options that are easier to implement.
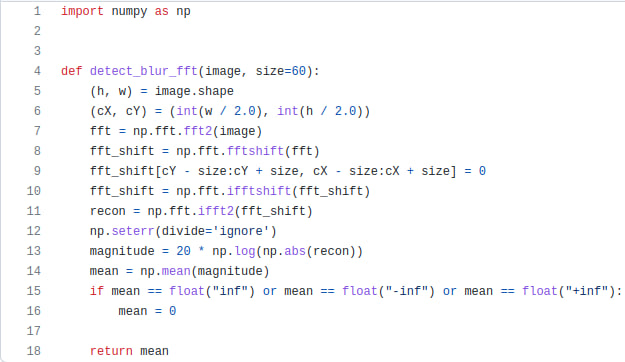
A good solution is described in the article Diatom autofocusing in brightfield microscopy: A comparative study. In this variant, a single image channel is taken, and the absolute value of the Laplace operator is calculated. Based on this method, we developed a Python module that determines the amount of blur in an image.
How the module determines the amount of blur
Each picture is made up of pixels. If the image is blurry, a smooth gradient is obtained on the border of objects. That is, the color of neighboring pixels changes gradually. If the image is clear, then the boundaries between objects are clear, and the color value of neighboring pixels on the border of objects changes sharply.
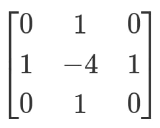
To determine the blurriness of an image, the Python module calculates the magnitude of the color gradient using the Laplace operator:
1. Takes one color channel of an image and wraps it with the following core:
2. Calculates the variance of the result, i.e., the standard deviation squared.
3. A coefficient is obtained by which one can judge the degree of blurring: the sharper the image, the greater the coefficient.
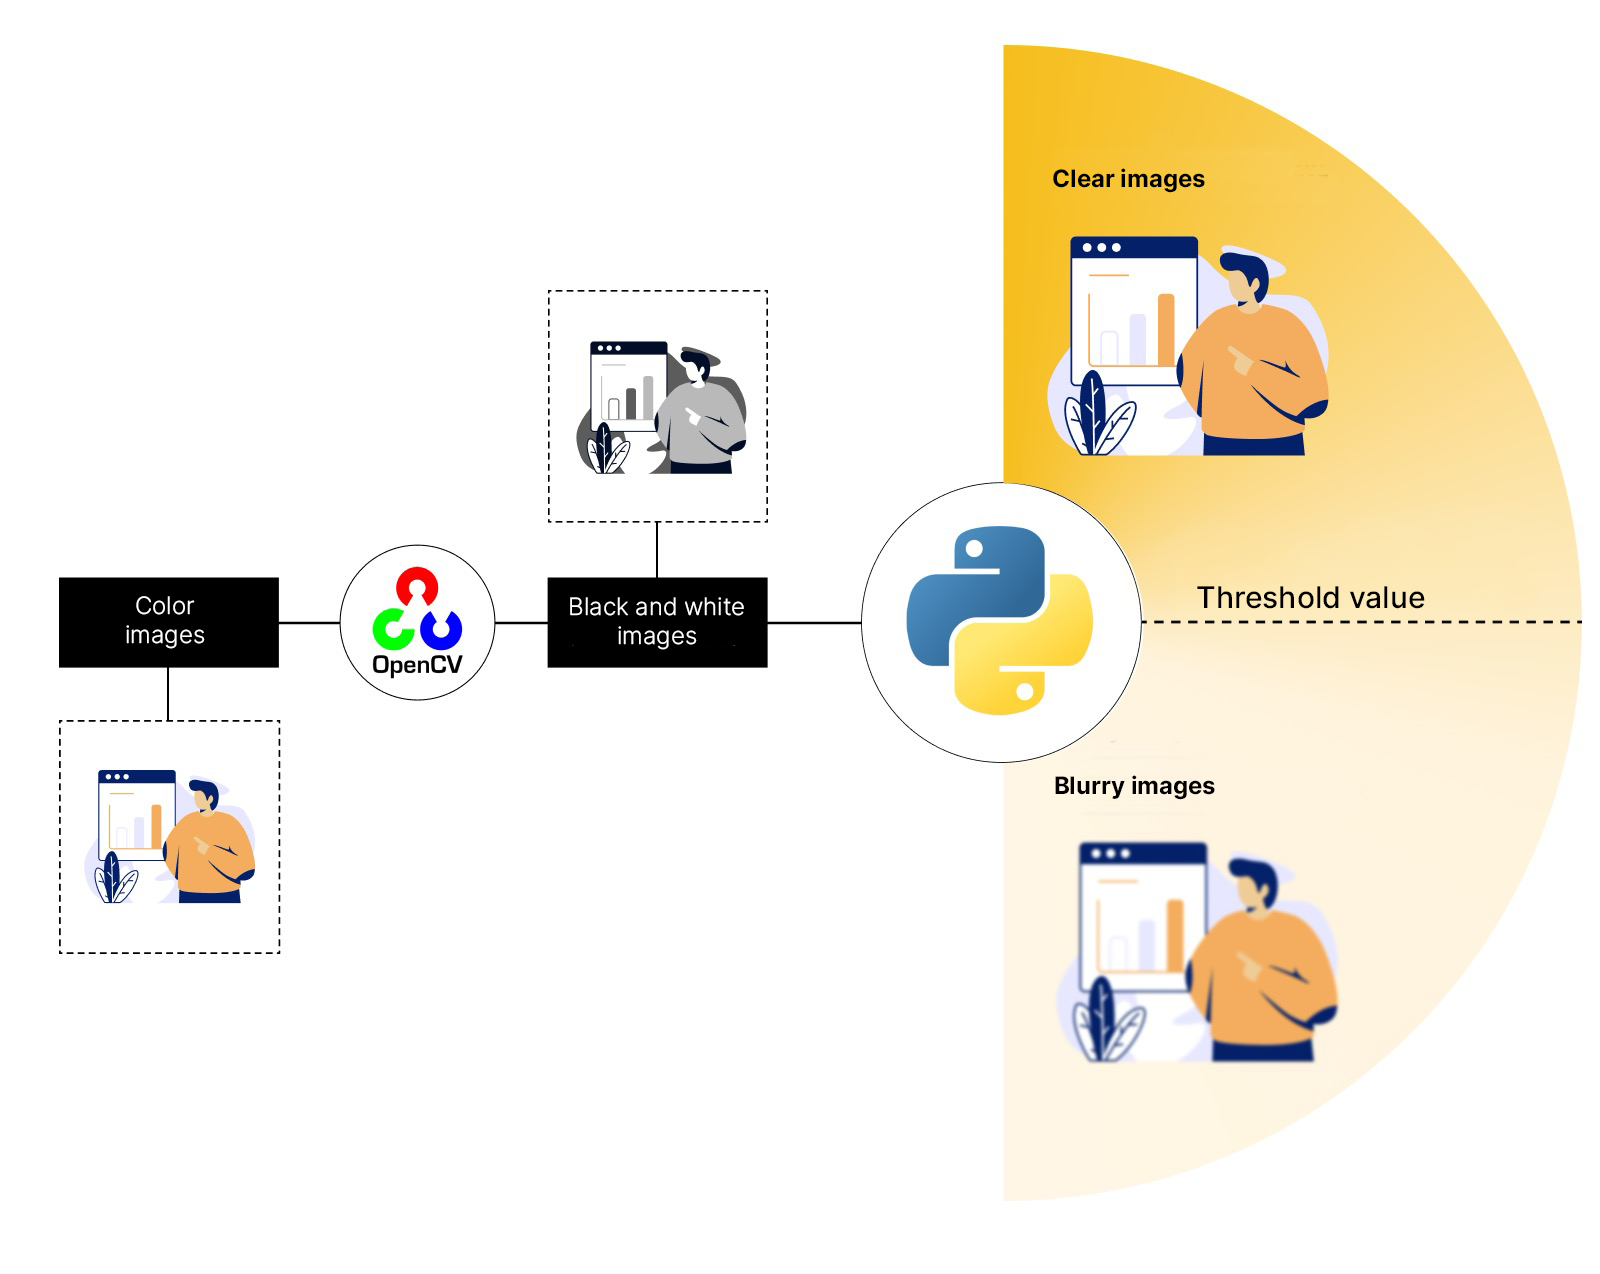
All previews on the platform are colored, and each color has its own gradient. When there are many colors, matching takes a long time. Therefore, we decided to convert images to black and white monochrome.
How the module converts images to monochrome
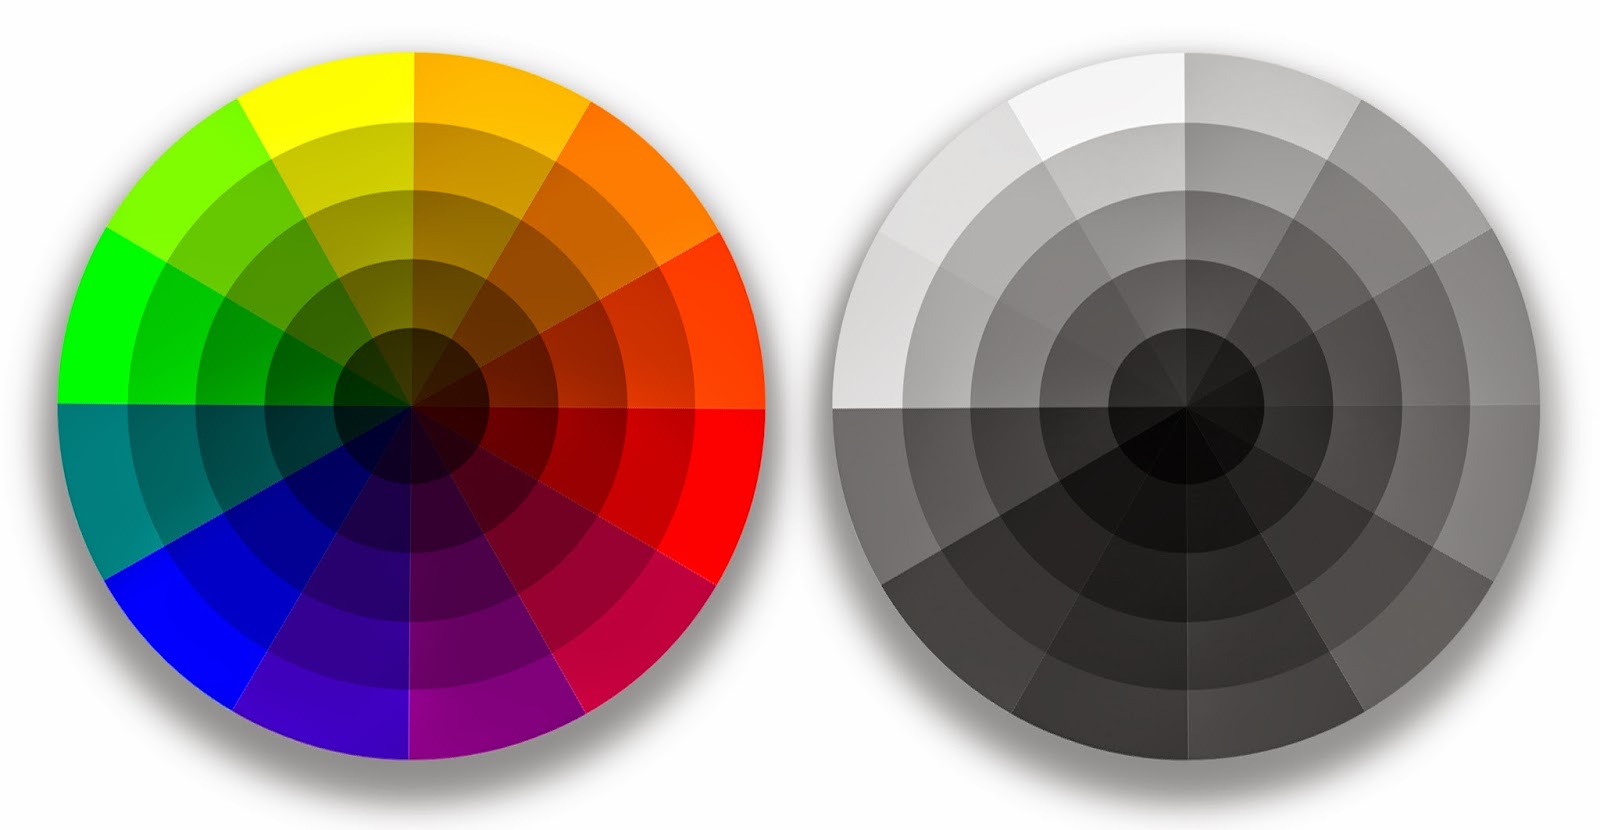
To convert color images to black and white, it was necessary to connect a library that can work with color. We tested several Python libraries and settled on OpenCV.
OpenCV is a computer vision library with which you can process, analyze, and classify images. It supports all popular file formats, and works well with image resolution, just what we needed for our task.
How the module evaluates image quality
The result of the algorithm is a coefficient that takes a value from 9 to 2000. The higher the value, the better the image quality.
An important point was to determine the threshold value of this coefficient: which images are considered sufficiently clear, and which are already blurry. We agreed with the customer that we will consider quality previews to be those with a coefficient of more than 100.
Result: the module found 4.7 million poor quality images, and 4.5 million excellent ones
1. Converts the previews uploaded to the platform to monochrome
2. Calculates the blur factor
3. Distributes images into one of two groups, depending on whether the coefficient is above or below the threshold value
Data science methods have allowed us to automate image quality assessment. Manually, it would take more than 14 thousand working hours. It took us less than 40 hours, from setting the task to obtaining the result.
The python module analyzed 50 million images and divided them into groups:
- 4.7 million blurry images: ratio from 0 to 100
- The rest are quite clear, of which 4.5 million are very good quality, where the coefficient is more than 1000
Over time, the customer removed all images of poor quality from the site. The number of views on the platform increased.